Danger-Maps, Belief and New Madrid

Most of the maps I’ve written about over the past year have been maps setting out the geographic formations of the world—regardless of how skewed the map-maker might have made the map in order to influence the beliefs of others. But some maps are made to represent truth and to save populations from dangers, so today we’re going to look at a specific type of map—those used to convey earthquake danger. I’ve been researching this because it relates specifically to the current novel I am writing called Aftershock.
Most of us are familiar with California’s San Andreas fault, the 800 mile long fault that stretches northwest-southeast in California and that brings Los Angeles (west of the fault) two inches closer to San Francisco (east of the fault) each year. This much-talked about fault line has been the subject of disaster movies and books, and also of reams of geological research. The damage caused by the fault’s quakes led the State of California to have the San Andreas and other surface faults mapped and to require disclosure of proximity to fault lines in any residential real estate dealings in the state. The trouble is, that even though these maps are available, most people – even those who have lived in proximity to a faults line seem uninformed about the dangers and new buyers of homes are positively unaware of their proximity to faults even though they sign disclosures in their ‘offer to purchase’ agreements. Why? Because maps and the language around them can either be used to convey danger or to minimize it. In the case of the California real estate disclosures they say that the house is in the San Andreas zone, but they don’t specifically use the language ‘earthquake fault zone’.
Another example or earthquake danger maps, and one dear to my heart (given I live on the south coast of British Columbia, Canada), are the ones that show the Ring of Fire around the Pacific Ocean basin. Nothing brings home the dangerousness of the place I live as seeing the numerous dots presenting quakes over 4.0 magnitude in recent history around the Pacific. You see, there are so many dots that a thick black line extends around virtually all of the Pacific except for the stretch bordering the Antarctic and a small section of North America – the part of the coast where I live. Okay, so there hasn’t been a moderately sized quake here in the past 20-30 years (yes, Seattle has had one, but not here, so far). In fact there hasn’t been a really big one here in a heck of a lot longer than that. But historical evidence and that ring of dots around the ocean says that there’s a very good chance one will happen one of these days. Around here we grow up being told to be earthquake prepared. Are we? Given the number of schools that haven’t been seismically upgraded, I’d say ‘no’, even though the maps are there to show us the danger.
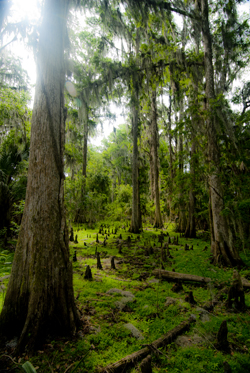
So why do we refuse to listen to the maps? A likely answer lays in another part of America. Right in the heartland of the U.S., where Missouri, Tennessee, Arkansas and Kentucky meet, in 1811/12 near the small community of New Madrid, a series of massive earthquakes (magnitude 7.5 and 8) wiped out entire fledgling towns, sent sand and water geysering into the air and lifted huge chunks of the landscape. The only thing that stopped huge loss of life was the fact that few people lived there.
Research into the quake says this type of quake will happen again. The trouble is the quake zone isn’t at the edge of a tectonic plate and there isn’t something like really a visible fault line to show where the quake will occur because these quakes occur far underground—that’s also why they are so devastating—and so life in the Midwest has mostly been focused on the danger of tornadoes, rather than the lurking danger right underfoot.
The trouble with this type of deep earthquake is that shockwaves travel farther and wreak more damage. In fact, geologists predict that such a quake today would be felt from Colorado to Washington D.C. and could wipe out most of the country’s central infrastructure.
As a result when, in 1990 a prominent inventor named Iben Browning predicted a major quake would occur in the New Madrid fault zone between December 1 and 5th of that year, the media promulgation of maps showing concentric areas of damage seriously impacting cities like St. Louis, Nashville, Birmingham, Little Rock, Jackson and Chicago started to get people taking the danger seriously. Children were kept home from school during the danger days. T.V. crews descended on the area like flies on road kill and everyone held their breath.
When nothing happened, of course finally people began to listen to the scientists who had previously laid out why the big one wasn’t likely to happen at that exact place and time. But the maps had done their damage. They’d laid out a ‘cartography of danger’ that hadn’t arisen. As a result, even though the states of Kentucky, Missouri, Arkansas and Tennessee try to prepare people for earthquakes because the risk of the big one still exists, they have an even more uphill battle than they do in California or here in the Pacific Northwest. You see, seeing a fault line on a map may not bring home the importance of believing, but when what you believe the danger presented on the map and then nothing happens, you’re less likely to believe in future danger.
So when the big one does hit, it will be Aftershock, indeed.
